Insights
Empower yourself and achieve your goals.
We have vast general knowledge on world development issues and specialist competence on energy related subjects. We are practicing continuous learning and collaborative knowledge sharing for building new insights and timeless experience. Please enjoy featured insights by clicking on a category of interest in the menu below.
demography
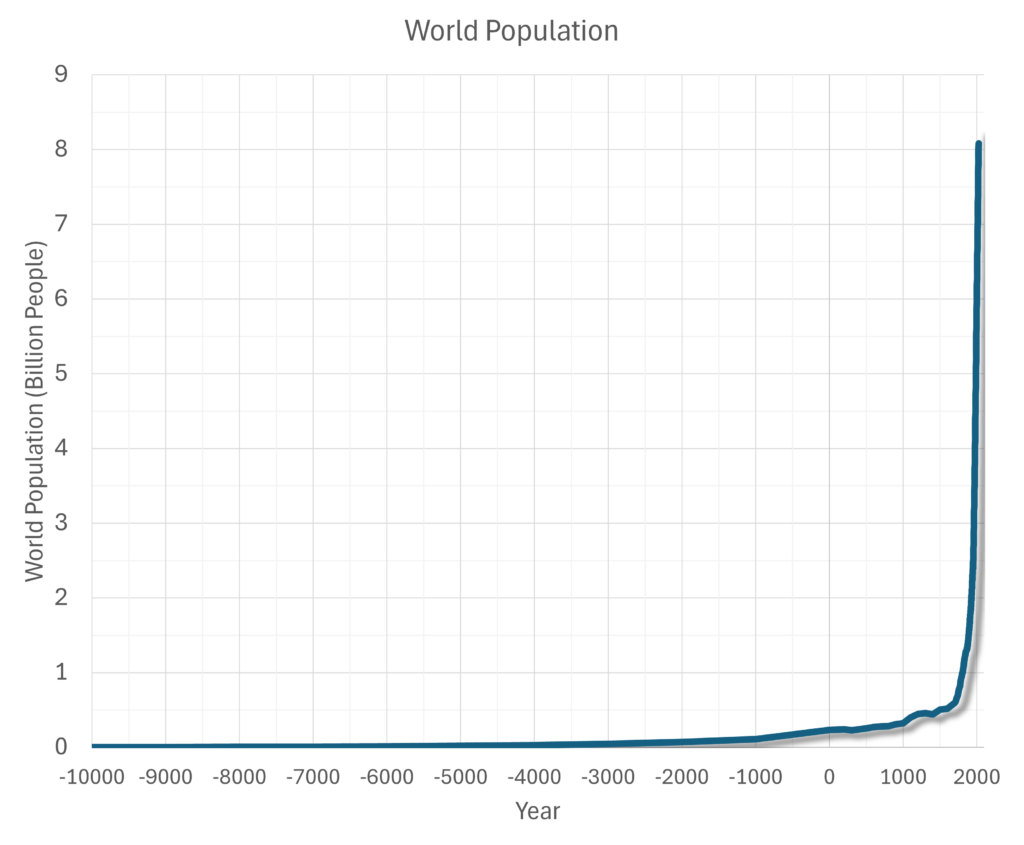
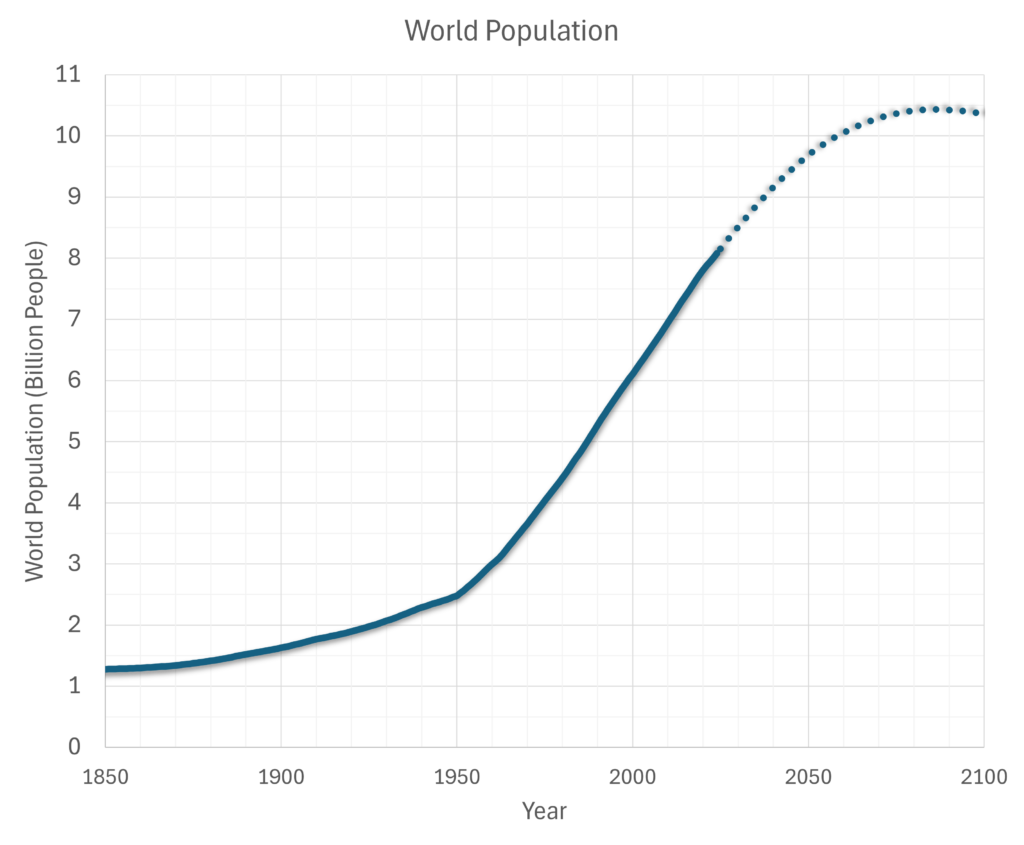
The world population passed 1 billion people in 1804, 2 billion in 1927, 8 billion in 2022, and is expected to peak in the 2080’s at about 10,4 billion people.
Before the 19th century the population was developing with relatively stable growth, but from then the population growth became much faster because of the industrial revolution, improved health care, and increased average lifetime. The population was around 4 million people in the year 10 000 BC and around 230 million people at year zero for comparison.
The world population development in period 10 000 BC until today, a zoom of the same development curve from 1850 until today (solid), and a projected development curve until 2100 (dotted), can be seen in the two graphs below [1-2].

energy consumption
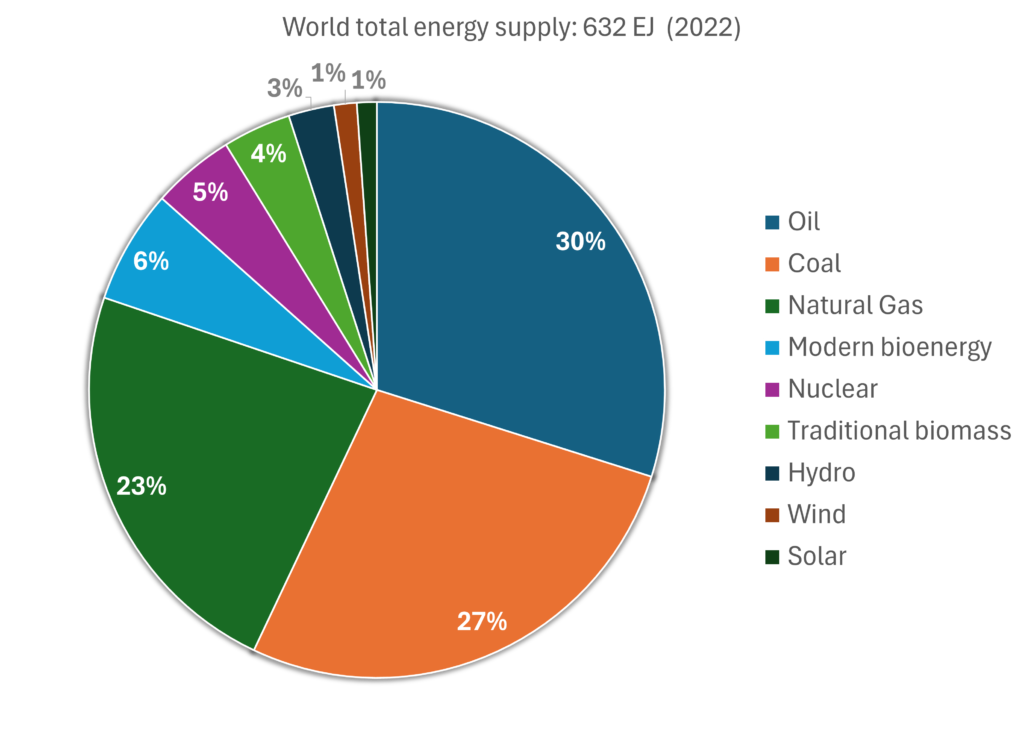
The total primary energy supplies of the world of 632 exajoule (EJ) are mainly based on fossil fuels. Oil, coal and natural gas alone are representing a staggering 80 percent of supplies. Traditional and modern bioenergy contribute with 10 percent and nuclear power with 5 percent. The renewables of hydro, wind, and solar power add up the remaining 5 percent combined. The world energy supply distribution of primary sources is shown in the chart to the left below.
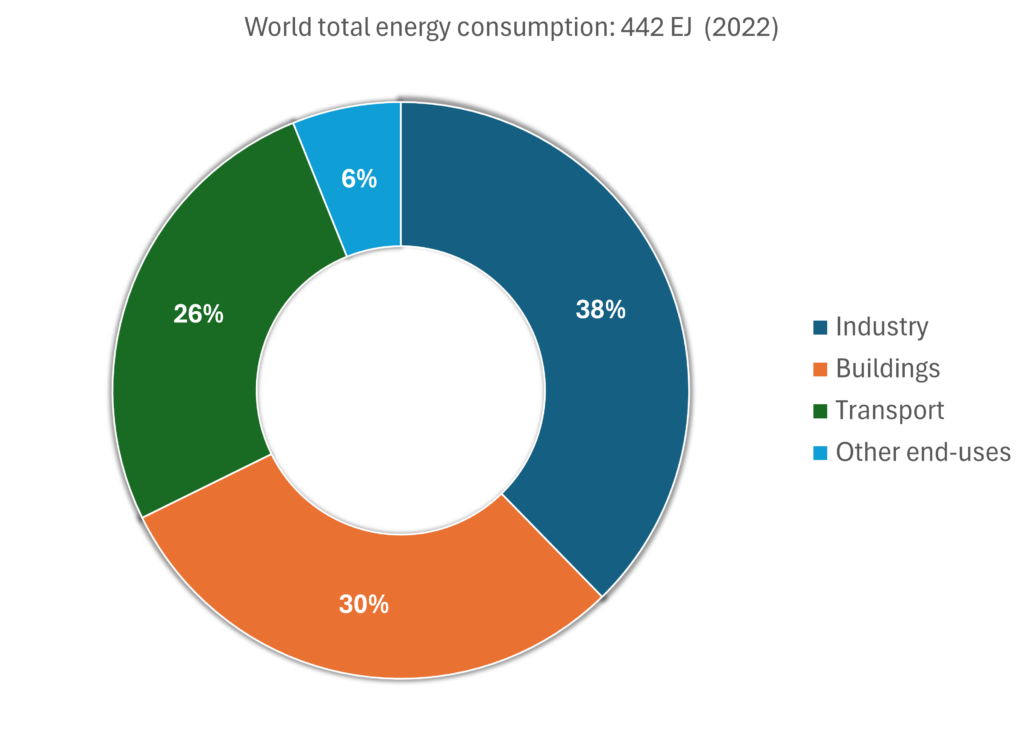
The total energy consumption of the world of 442 EJ is used for industry, buildings, transport, and other end-uses with a share of 38%, 30%, 26%, and 6%, respectively, as illustrated in the chart to the right below.
The difference between the world total energy supply and the world total energy consumption of 190 EJ is primarily due to energy losses in conversion processes, where a significant amount is lost as heat, and non-energy uses [3].

Greenhouse gas emissions
Gases that trap heat in the atmosphere are called greenhouse gases. The most influential greenhouse gases that are affected by human activities in their growing concentrations in the atmosphere are Carbon Dioxide (CO2), Methane (CH4), Nitrous Oxide (N2O), and Sulfur Hexafluoride (SF6). They all absorb radiation from the Earth when reflected sunlight are contained by these gases fairly like a greenhouse. CO2 is of paramount concern as it contributes most in warming the Earth and to climate change [4-8].
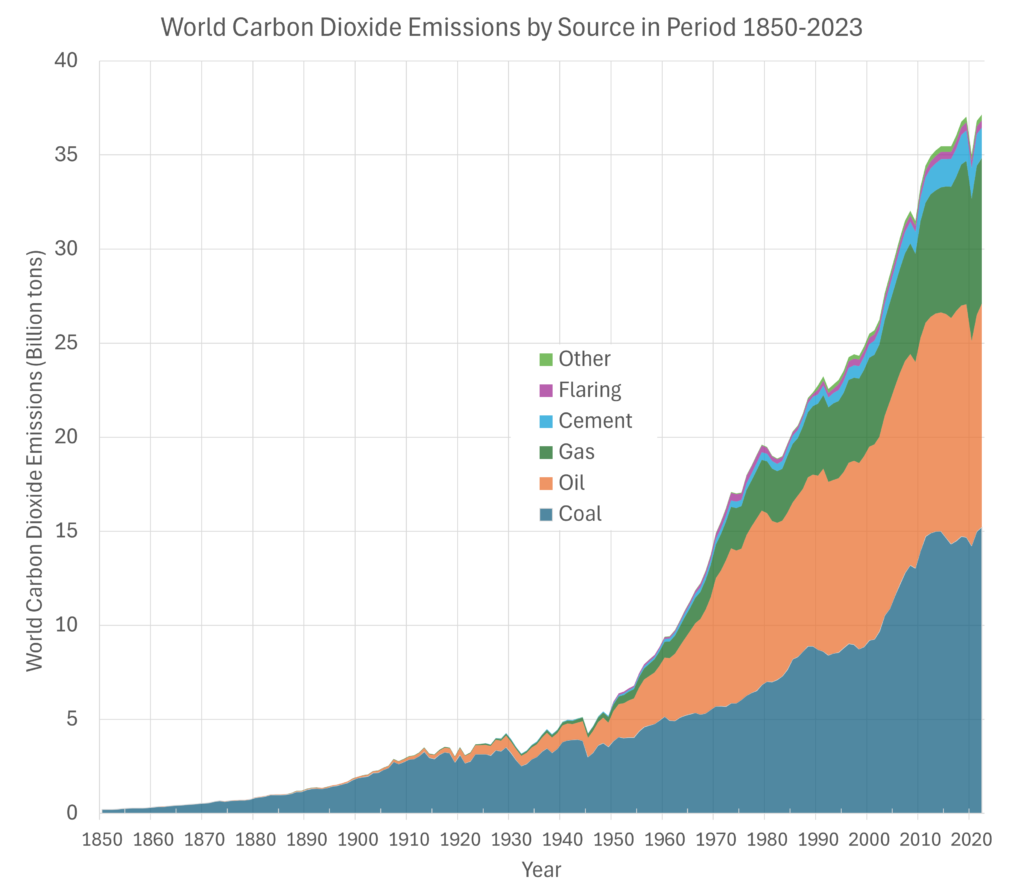
The annual emissions of carbon dioxide have never been higher than today and were 37 billion tons in 2022. Coal, oil, gas, cement, flaring, and other sources represent 41%, 32%, 21%, 4%, 1%, and 1% of the global emissions, respectively. The carbon dioxide emissions from different sources and their development in period 1850 to 2023 are shown in the upper right graph below [9].
The main human activity that emits CO2 is the combustion of fossil fuels (coal, natural gas, and oil) for energy and transportation. Certain industrial processes and land-use changes also emit CO2. Human activities release more carbon dioxide into the atmosphere than natural processes can absorb each year, causing the concentration of carbon dioxide in the atmosphere to increase.
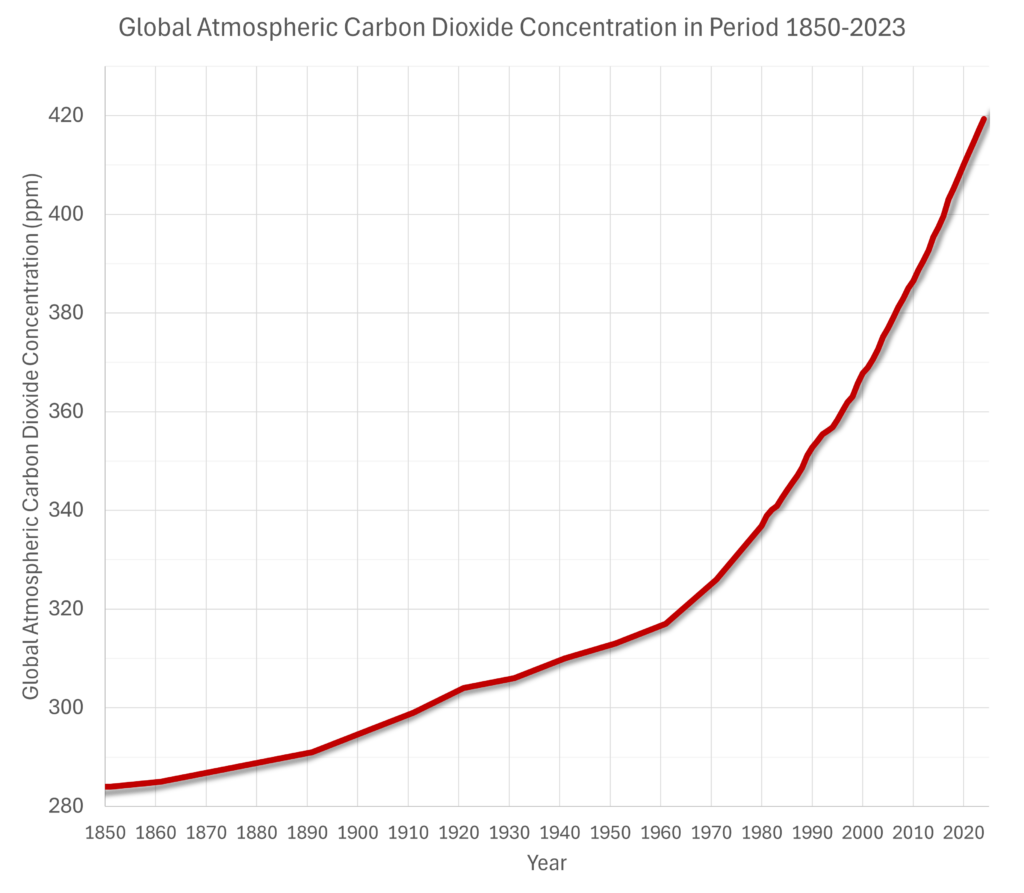
Carbon dioxide remains in the climate system for a very long time. The accumulated CO2 emissions result in CO2 concentrations that will last thousands of years. The global average carbon dioxide concentration set a record high in 2023 with 419 parts per million (ppm), and 2022 was the 12th year in a row where the concentration increased by more than 2 ppm from the previous year. The global atmospheric CO2 concentration in period 1850 to 2023 are shown in the lower right graph below. The global atmospheric concentration of CO2 has rosen by 50 percent from about 280 ppm in the pre-industrial era to about 420 ppm today [10].


climate change
Climate change affects the environment in various ways, including rising temperatures, sea level rise, drought, flooding, and more [4-8], [11-13].
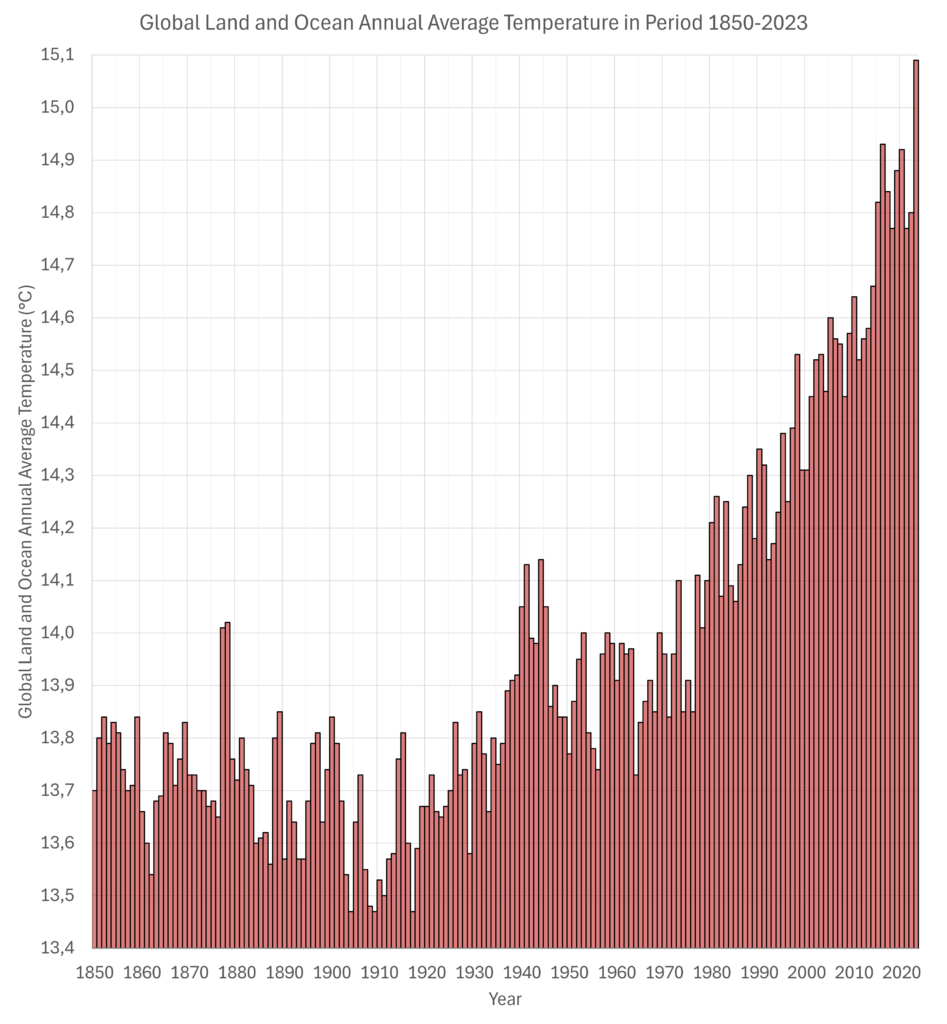
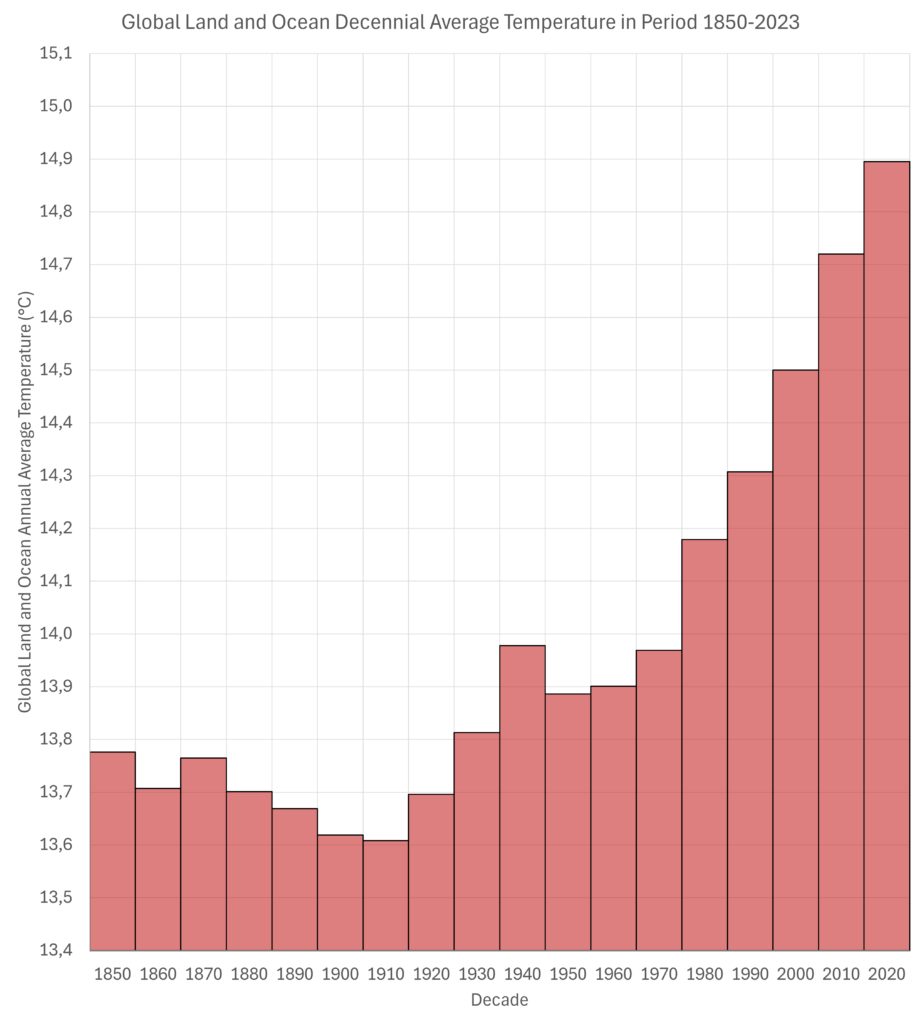
The global land and ocean annual average temperatures in period 1850–2023 are shown in the left chart below based on measurement data from accurate instruments [5,14]. Decennial averaged temperatures based on the same source data are shown in the right chart below for filtering annual variations and highlighting trends more transparently. The bar in the chart for decade 2020’s is the average for the first four years of the decade only.
The decade with the lowest global land and ocean average temperature was the 1910’s with a temperature of 13,6°C, while a century later the average temperature of the 2010’s was 14,7°C.
The highest global land and ocean annual average temperature ever measured was 15,1°C for 2023, which is 1,6°C higher than for the lowest temperature of 13,5°C that was measured for a few individual years around 1910.

electric vehicles
The global sales of electric cars are growing rapidly, and 18 percent of new cars sold were electric in 2023. The share of electric cars was 93 percent in Norway, 60 percent in Sweden, 38 percent in China, 22 percent in the EU, 10 percent in the USA, and 2 percent in India, respectively [15].
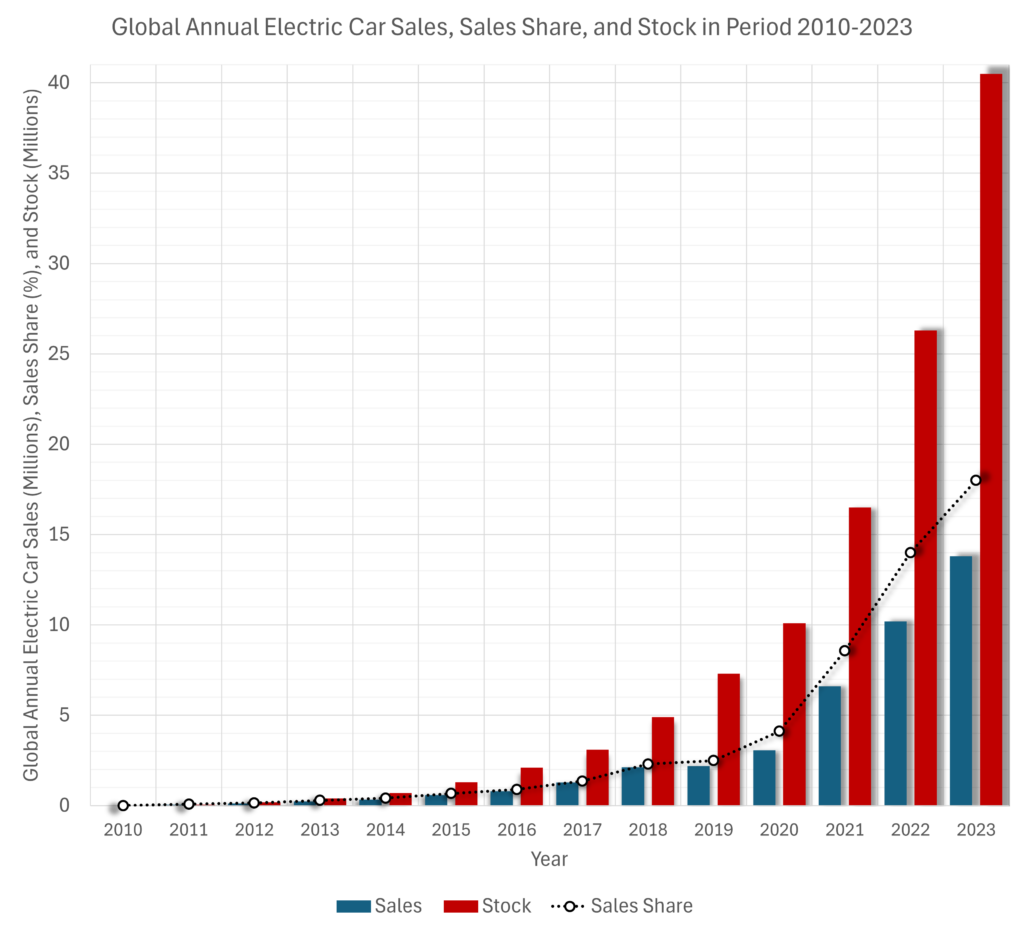
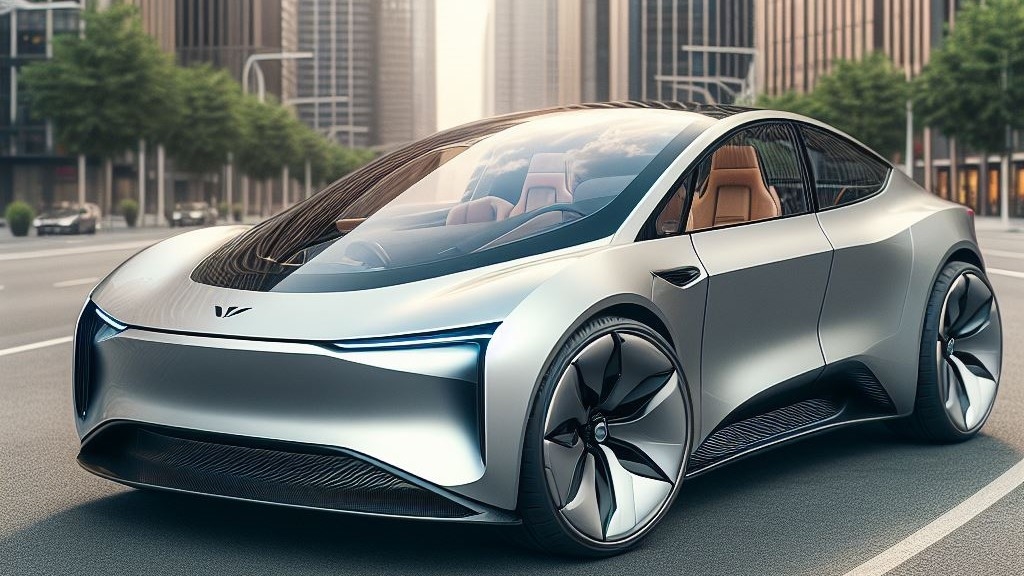
The global stock of electric cars, which was practically negligible in 2010, passed 40 million with annual sales of almost 14 million in 2023, including zero emission electric vehicles and plug-in hybrid electric vehicles [15]. The data are illustrated in the graph left below.
The trend of decarbonization of the car fleet will certainly continue, not least in Europe after the EU in 2023 made the final adoption of a law that will require all new cars sold to have zero CO2 emissions from 2035. The road transport accounts for one fifth of the EU’s CO2 emissions and therefore the law will support the goal to reach climate neutrality by 2050 [16-18].
wind power
Onshore wind power is a proven technology and offshore wind power is expected to have rapid growth in the coming years as turbines at sea take advantage of stronger winds and additional general support. Wind is a leading renewable source of power generation and therefore an imperative technology for the UN’s goal of realizing net zero emissions (NZE) by 2050.
The annual wind power generation is expected to pass 2 700 TWh in 2024, as illustrated in the chart below [3].
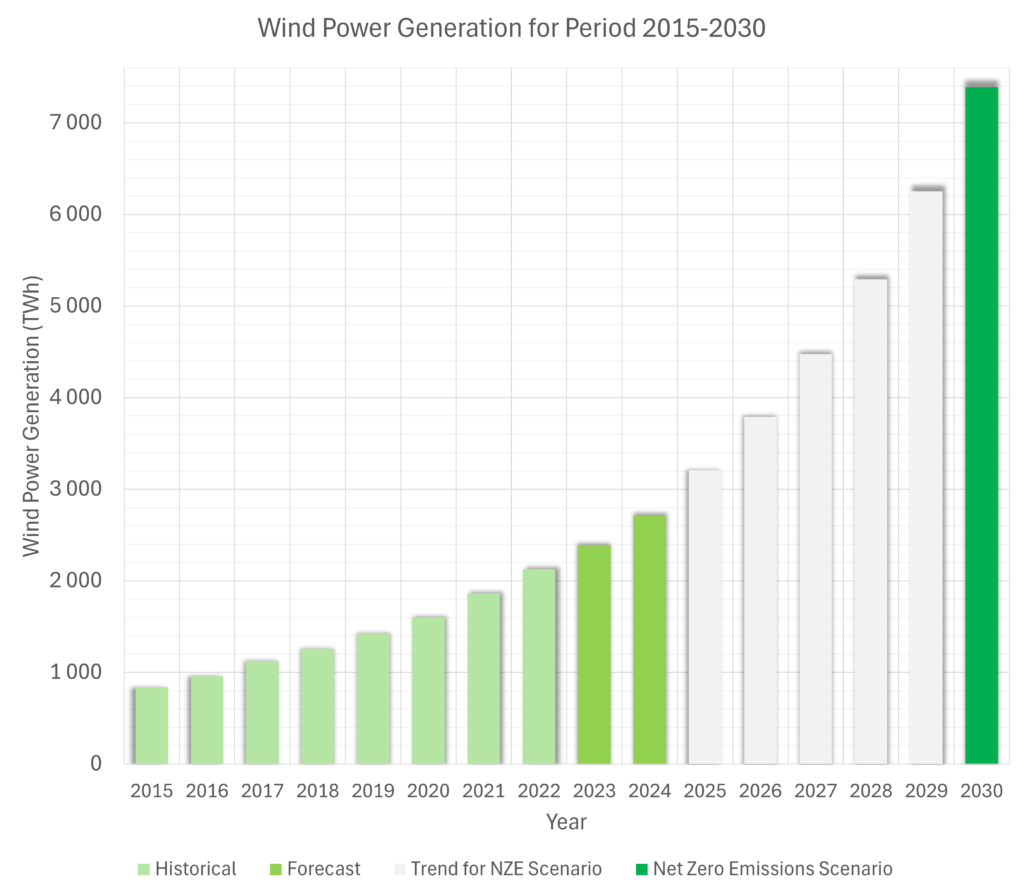
The intermediate target in the NZE scenario stipulates an annual wind power generation of around 7 400 TWh in 2030, which requires an annual average growth rate of more than 18 percent, equivalent to a doubling of electricity production in about a four-year period [3].
solar power
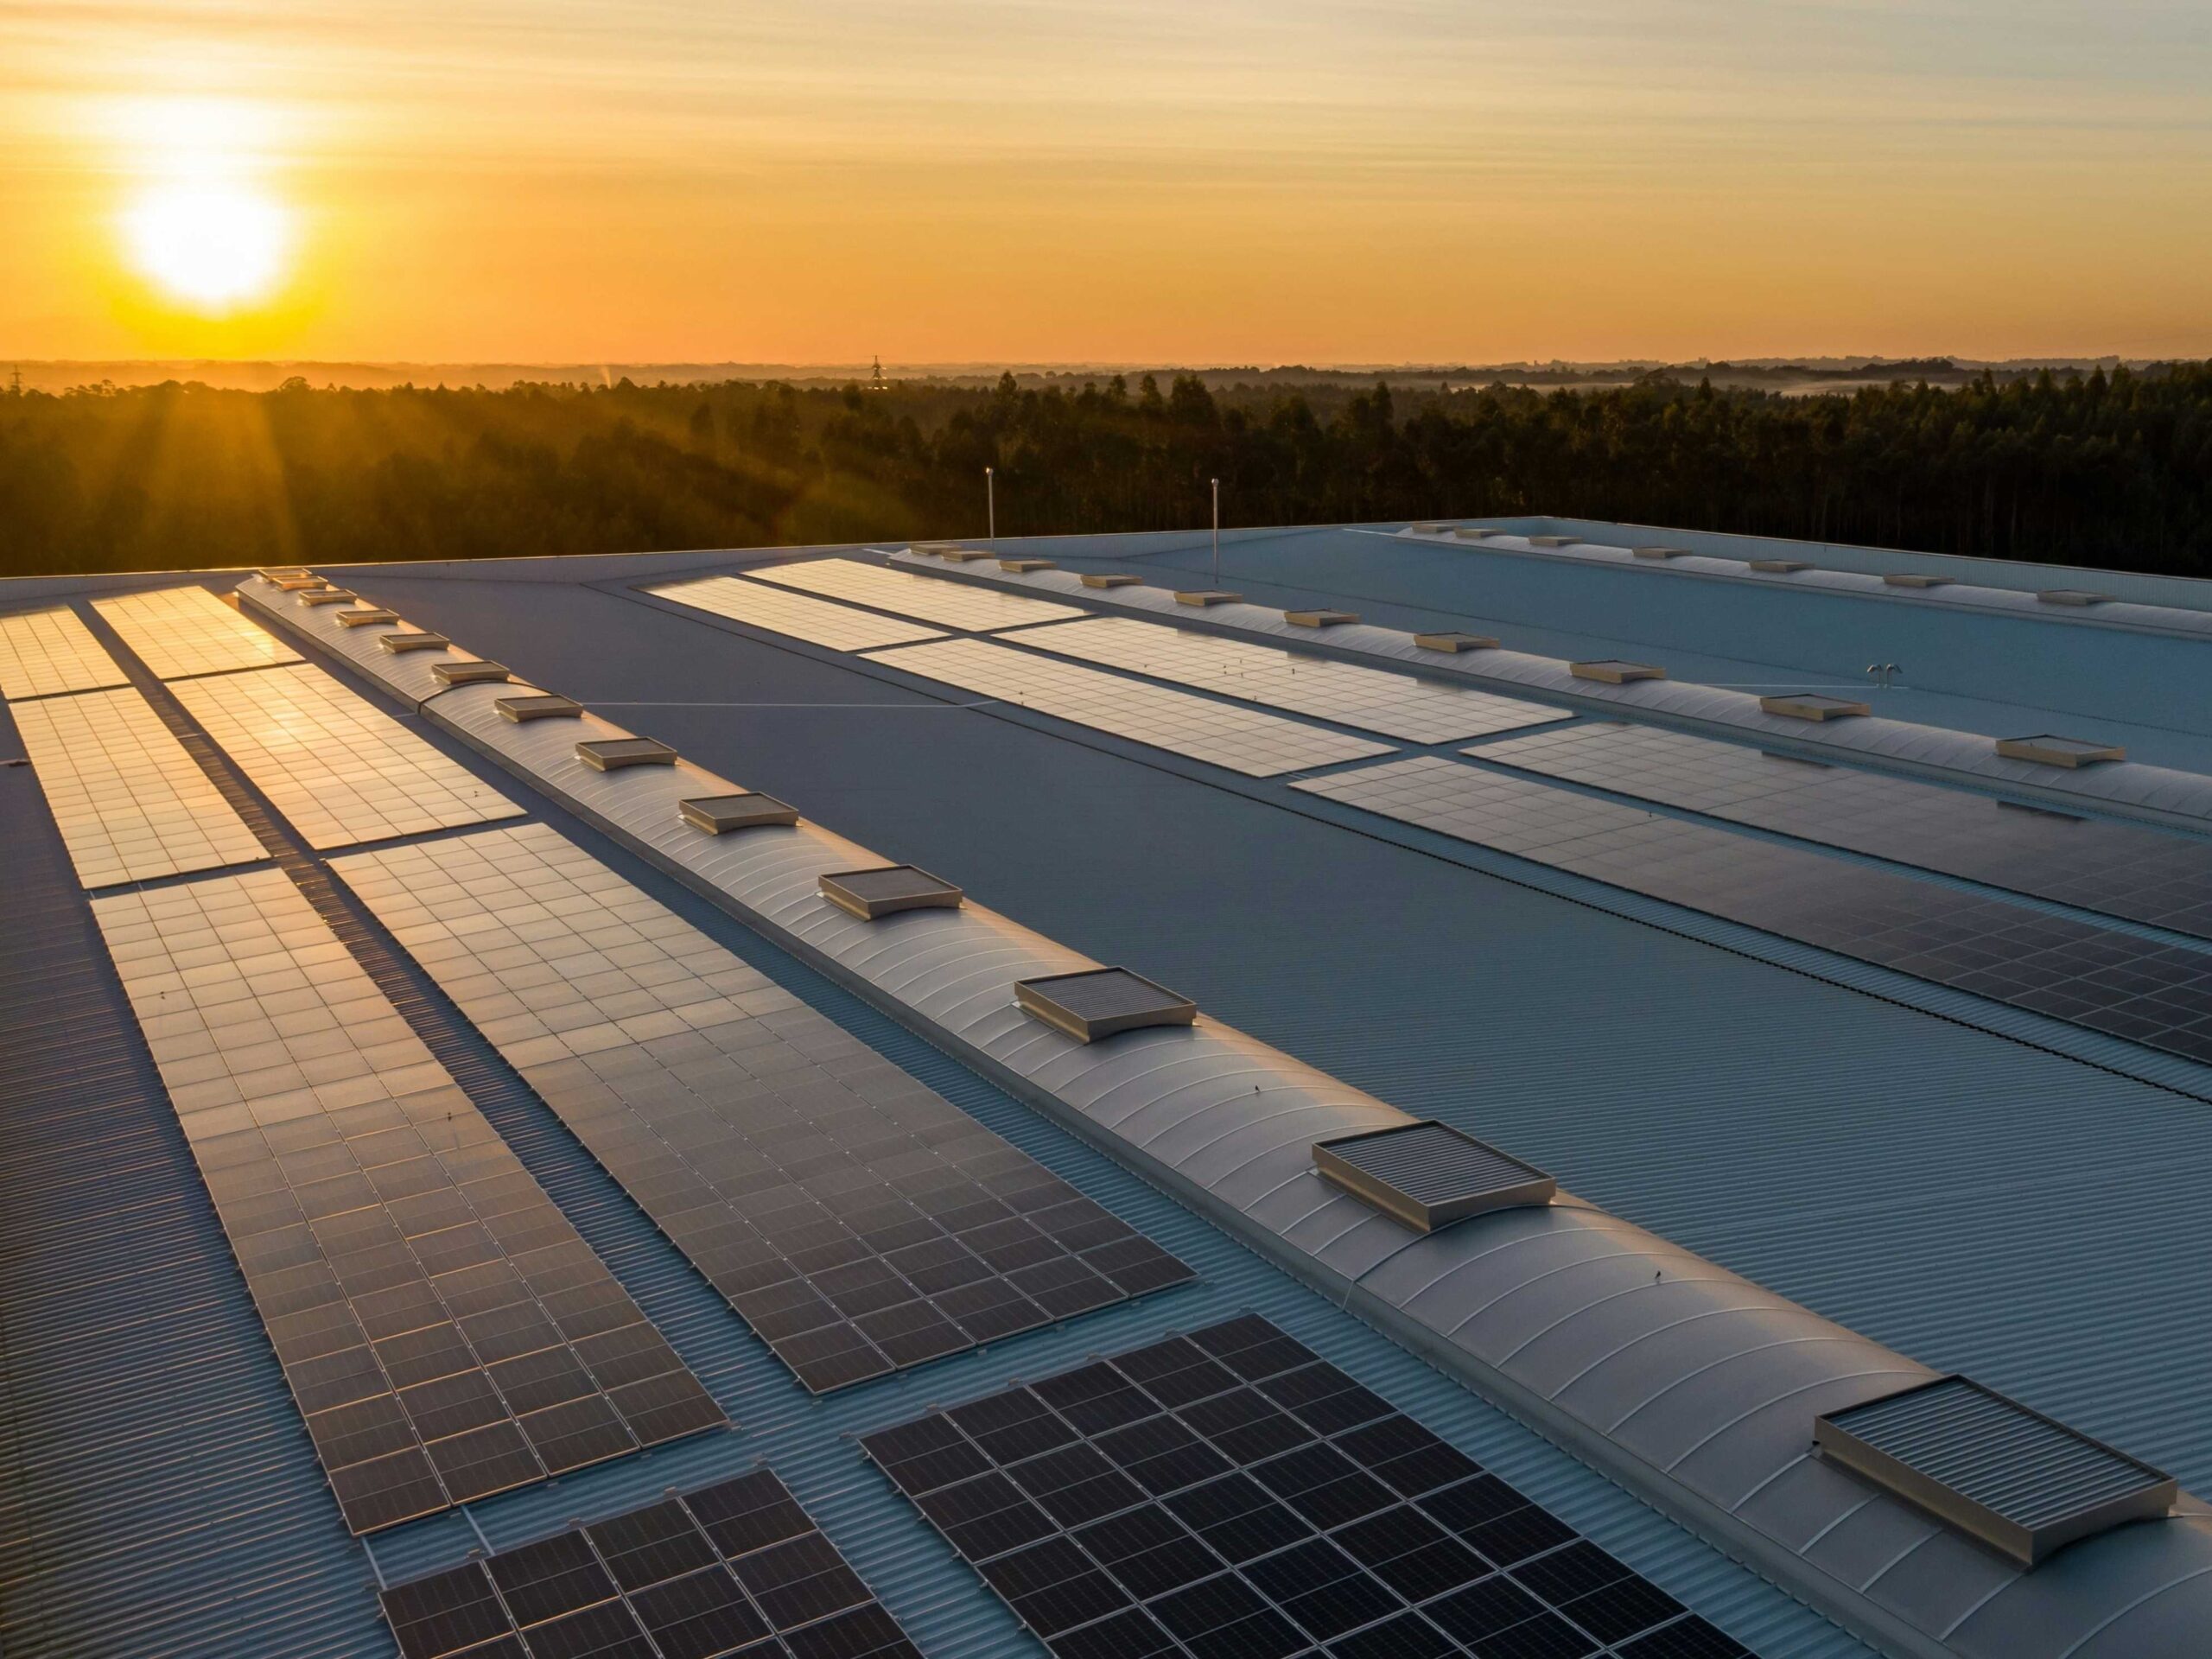
Solar photovoltaics (PV) power is a modular and renewable technology for a wide range of applications, from small residential roof-top installations up to utility-scale generation systems. Utility-scale solar PV power has in recent years become the least costly option for new electricity generation in most countries worldwide. Distributed power generation, such as solar PV on roof-tops of buildings, is also set for even faster growth because of higher electricity prices, both in network and trade, and better policy incentives [3].
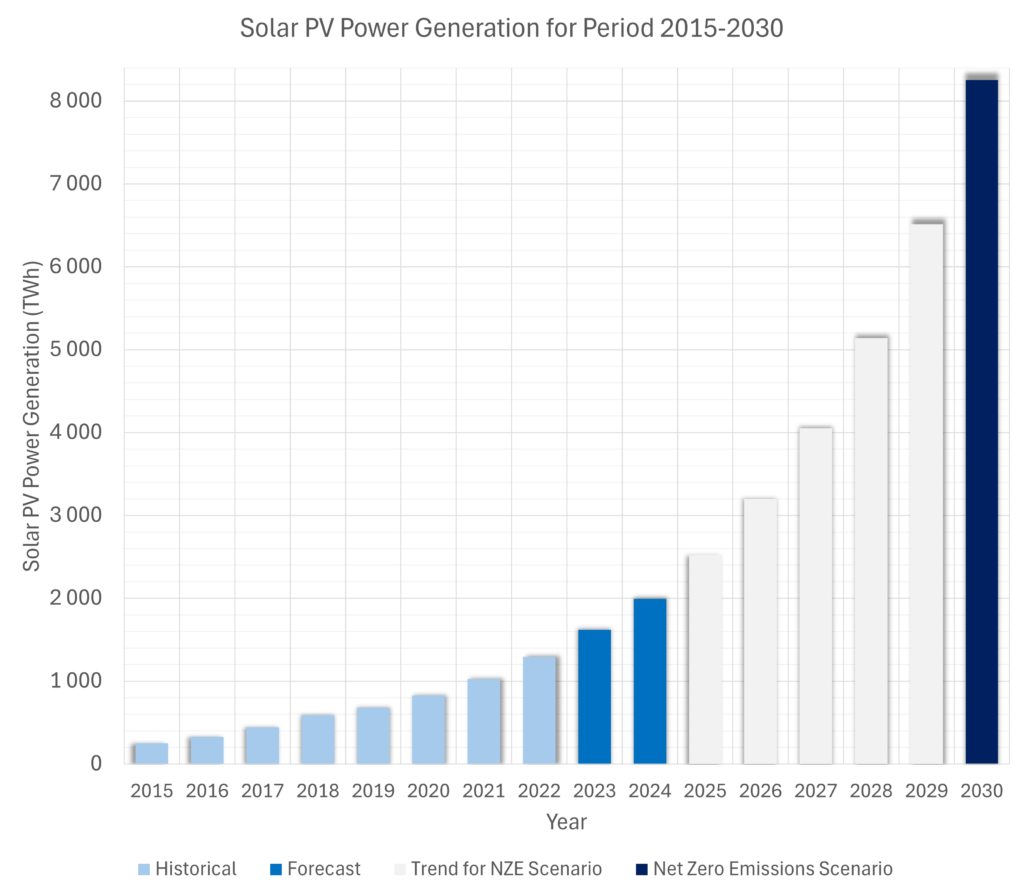
The annual solar PV power generation is expected to reach nearly 2 000 TWh in 2024, as illustrated in the chart left below [3].
An annual solar PV power generation of around 8 200 TWh is projected in 2030 in accordance with the net zero emissions by 2050 scenario of the UN, which requires an annual average growth rate of 27 percent, equivalent to a doubling of production in about a three-year period.
Solar PV power is expected to surpass wind power in electricity production before 2030 and is destined to become a central renewable generation source.
heating and ventilation
Buildings are responsible for 30 percent of the world energy consumption, largely relied on fossil fuels, and most are used for heating, ventilation, and cooling. Heat pumps have the potential to significantly reduce GHG emissions as they produce heat from abundant geothermal sources and use electricity as power supply that requires only a fraction of electrical energy compared to the heat energy that they deliver. Hence, the technology is very economically rewarding for potential consumers, for family houses, multi-family homes, offices, and factories.
Governments across the globe are pointing towards large expansions of the use of heat pumps announced in policy plans for environmental sustainability measures, and thus heat pump technology is projected to jump from 1 000 GW in 2021 to nearly 2 600 GW by 2030, increasing their global share of total heating capacity of buildings from 10 percent to about 20 percent [3].
Heat pumps can in addition to heat also produce cooling, which is an attractive functionality for comfort, when the weather conditions change with the seasons. Heat pumps run on electricity and can therefore profitably be combined with solar PV power installations for more sovereign operation of buildings.
Ventilation systems are important for indoor climate conditions, but some systems are associated with significant energy waste, while other ventilation systems are utilizing efficient energy recycling of the heated exhaust air. Ventilation systems with energy recycling can favorably be utilized together with heat pumps.

references and acknowledgements
References
[1] United Nations, Department of Economic and Social Affairs, Population Division (2022), “World Population Prospects 2022”, Online Edition.
[2] Our World In Data, Global Change Data Lab, “Population, 10 000 BCE to 2023, World”, July 15, 2024.
[3] International Energy Agency (IEA), “World Energy Outlook 2023”, URL: https://www.iea.org, October 24, 2023.
[4] National Oceanic and Atmospheric Administration (NOAA), Global Monitoring Laboratory, “Basics of the Carbon Cycle and the Greenhouse Effect”, URL: https://gml.noaa.gov, October 2, 2024.
[5] National Oceanic and Atmospheric Administration (NOAA), “Annual 2020 Global Climate Report”, URL: https://www.ncei.noaa.gov, August 25, 2021.
[6] National Oceanic and Atmospheric Administration (NOAA), “Climate Change: Atmospheric Carbon Dioxide”, URL: https://www.climate.gov, April 9, 2024.
[7] Environmental Protection Agency (EPA), “Understanding Global Warming Potentials” URL: https://www.epa.gov, August 8, 2024.
[8] Environmental Protection Agency (EPA), “Overview of Greenhouse Gases” URL: https://www.epa.gov, April 11, 2024.
[9] Our World In Data, Global Change Data Lab, “CO2 emissions by fuel or industry type, World”, Global Carbon Budget (2023), June 20, 2024.
[10] National Oceanic and Atmospheric Administration (NOAA), “Global Annual Mean CO2 Concentration”, URL: https://www.climate.gov, File creation: 5 August 2024.
[11] United Nations, “Report of the World Commission on Environment and Development: Our Common Future”, March 20, 1987.
[12] IPCC, 1990: Climate Change: The IPCC Scientific Assessment. Report Prepared for the Intergovernmental Panel on Climate Change by Working Group 1 [Core Writing Team, J.T. Houghton, G.J. Jenkins and J.J. Ephraums (eds.)], July, 1990.
[13] IPCC, 2023: Climate Change 2023: Synthesis Report. Contribution of Working Groups I, II and III to the Sixth Assessment Report of the Intergovernmental Panel on Climate Change [Core Writing Team, H. Lee and J. Romero (eds.)]. IPCC, Geneva, Switzerland, 184 pp., March 19, 2023.
[14] National Oceanic and Atmospheric Administration (NOAA), “Global Land and Ocean January-December Average Temperature Anomalies”, URL: https://www.ncei.noaa.gov, File creation: 9 July 2024.
[15] International Energy Agency (IEA), “Global EV Outlook 2024”, URL: https://www.iea.org, April 23, 2024.
[16] EU, “EU ban on the sale of new petrol and diesel cars from 2035 explained”, URL: https://www.europarl.europa.eu, June 30, 2023.
[17] EU, “European Climate Law”, URL: https://climate.ec.europa.eu, July 29, 2021.
[18] EU, “Fit for 55: EU reaches new milestone to make all new cars and vans zero-emission from 2035”, URL: https://climate.ec.europa.eu, March 28, 2023.

Acknowledgements
We are proudly acknowledging the photos by Raphael Andres, Joshi Milestoner, Tapio Haaja, Oliver Cole, Patrick Federi, Frantisek Duris, Philip Myrtorp, Fanny Gustafsson, Nazrin Babashova, Sasha Matic, Linus Mimietz, John O’Nolan, Arto Marttinen, Nicola Gambetti, Johny Goerend, Donald Giannatti, Julien Tromeur, Aaron Burden, Thisisengineering, Lukas Blazek, Wd Toro, Markus Spiske, Tobias Weinhold, Jeshoots, Giammarco Boscaro, Calitore, Marvin Meyer, Javier Quesada, Benjamin Jopen, Erik Gonzalez Guerrero, Sandro Katalina, Robert Bye, Bilge Tekin, Detait, Annie Spratt, Margalit Toyber, Hyundai Motor Group, American Public Power Association, Jason Mavrommatis, Zhen Yao, Claudio Schwarz, Katie Moum, Ricardo Gomez Angel, Andreas Gucklhorn, Randall Meng, Cristoph Grabietz, Matthew Schwartz, Matt Noble, Vedanth Ravi, NASA, Chris Leboutillier, Gustavo Quepon, Nuno Marques, Denys Nevozhai, Galactic Nikita, Chris Munch, Manuel Meurisse, Ian Schneider, and Carl Wang with courtesy on Unsplash, Microsoft AI image generator, Johan Eriksson at Logotypcenter, and Pia Nordlander at bildN.


